Laravel 9 Add Charts Using Chart.Js Example
5 minutes read
Hello today we are going to implement charts in Laravel 9. For better understand we will give example of Laravel 9 with chartjs. This tutorial will be simple example for beginner to start how to add chart in Laravel 9. The below will help you to create basic example of Chartjs Laravel 9. Anyway if you are looking for basic tutorial of Laravel, check out my tutorial Laravel CRUD Operation Paging From Scratch
Add Charts Using Chart.Js Example
We can create a bar chart, pie chart, and line chart using chartjs in Laravel. Chart js is open source high responsive and flexible JavaScript charting for designers & developers.
- Step 1 - Install Laravel Project
- Step 2 - Create Model & Migration
- Step 3 - Create Factory (Sample Data)
- Step 4 - Create Controller
- Step 5 - Add Route
- Step 6 - Create View (Blade)
- Step 7 - Run Laravel Server
Step 1 - Install Laravel Project
What we need to do is to install Laravel Project in your local machine. Following the article I wrote how to install Laravel via composer and configure database. This is required internet connection make sure you have stable connection.
Step 2 - Create Model & Migration
Create Model
We will create a model class called "Student". Follwing command artisan to generate a migration file and a model class, you may use the --migration or -m option to create migrate file.
php artisan make:model Student -m
Open file app -> models -> student.php
<?php

namespace App\Models;

use Illuminate\Database\Eloquent\Factories\HasFactory;
use Illuminate\Database\Eloquent\Model;

class Student extends Model
{
    use HasFactory;

    protected $fillable = [
        'first_name', 'last_name', 'gender', "dob"
    ];
}
Update Migration
Open file database -> migrations -> 2022_06_11_023112_create_students_table.php
<?php

use Illuminate\Database\Migrations\Migration;
use Illuminate\Database\Schema\Blueprint;
use Illuminate\Support\Facades\Schema;

return new class extends Migration
{
    /**
     * Run the migrations.
     *
     * @return void
     */
    public function up()
    {
        Schema::create('students', function (Blueprint $table) {
            $table->id();
            $table->string('first_name');
            $table->string('last_name');
            $table->string('gender');
            $table->date('dob');
            $table->timestamps();
        });
    }

    /**
     * Reverse the migrations.
     *
     * @return void
     */
    public function down()
    {
        Schema::dropIfExists('students');
    }
};
After place those code make sure you have update database connection in .env correctly then run below command to create table in database.
php artisan migrate
Step 3 - Create Factory (Sample Data)
This section is for generate sample test data. If you already have data please skip this step. Now let's setup a factory for students sample data by following command.
php artisan make:factory StudentFactory --model=Student
The command will generate a factory file then update below code to generate data.
Open file database -> factories -> StudentFactory.php
<?php

namespace Database\Factories;

use Illuminate\Database\Eloquent\Factories\Factory;

/**
 * @extends \Illuminate\Database\Eloquent\Factories\Factory<\App\Models\Student>
 */
class StudentFactory extends Factory
{
    /**
     * Define the model's default state.
     *
     * @return array<string, mixed>
     */
    public function definition()
    {
        return [
            'first_name' => $this->faker->name,
            'last_name' => $this->faker->name,
            'gender' => $this->faker->randomElement(['male', 'female']),
            'dob' => $this->faker->date($format = 'Y-m-d', $max = 'now'),
        ];
    }
}
We are going to generate sample 100 records of students table of different using following command:
php artisan tinker

Student::factory()->count(100)->create()
Step 4 - Create Controller
Next we will create new controller named "ChartController" by the command below.
php artisan make:controller ChartController
The command will generate a file and after that update following code below
Open file app -> Http -> Controllers -> ChartController.php
<?php

namespace App\Http\Controllers;

use Illuminate\Http\Request;
use DB

class ChartController extends Controller
{
    public function getStatistic()
    {
        $rs = DB::table('Students')
        ->selectRaw("count(case when gender = 'male' then 1 end) as male")
        ->selectRaw("count(case when gender = 'female' then 1 end) as female")
        ->first();
        $data = [];
        $data['data'] = $rs;
        $data['title'] = "Student in Class B";
        return view('chart',['data'=>$data]);
    }
}
We are going to adding a route which is point to controller and method.
Open file routes -> web.php
<?php

use App\Http\Controllers\StudentController;

....

Route::get('/chart', [StudentController ::class, 'getStatistic']);
Step 6 - Create View (Blade)
We need a web to render HTML to display Chart data, so let's create a blade file in following directory.
Create file resources -> views -> chart.blade.php
<!DOCTYPE html>
<html>
<head>
  <title>Laravel 9 Pie Chart JS Example Tutorial - CamboTutorial.com</title>
  <link href="https://cdn.jsdelivr.net/npm/bootstrap@5.0.2/dist/css/bootstrap.min.css" rel="stylesheet">
 <script src="https://cdnjs.cloudflare.com/ajax/libs/Chart.js/3.8.0/chart.min.js"></script>
</head>
<body>
  <div class="container">
    <h1>Chart JS Laravel 9 - CamboTutorial.com</h1>
    <div class="row">
        <div class="col-md-6">
            <div class="card">
                <div class="card-header">
                    <h3>Statistic</h3>
                </div>
                    <div class="card-body">
                        <canvas id="pie-chart" width="400" height="400"></canvas>
                    </div>
                </div>
            </div>
        </div>
    </div>
  </div>
<script>
new Chart(document.getElementById("pie-chart"), {
    type: 'pie',
    data: {
      labels: ['Female','Male'],
      datasets: [
        {
          backgroundColor: ["#f60000","#0013ff"],
          data: [ {{ $data['data']->female}}, {{ $data['data']->male }} ]
        }
      ]
    },
    options: {
        maintainAspectRatio: false,
        plugins:{
            title: {
                display: true,
                text: '{{ $data["title"] }}'
            },
       }
    }
});
</script>
</body>
</html>
Step 7 - Run Laravel Server
Now we ready for testing the application. By following command to run Laravel server.
php artisan serve
Open following URL http://localhost:8000/chart via browser
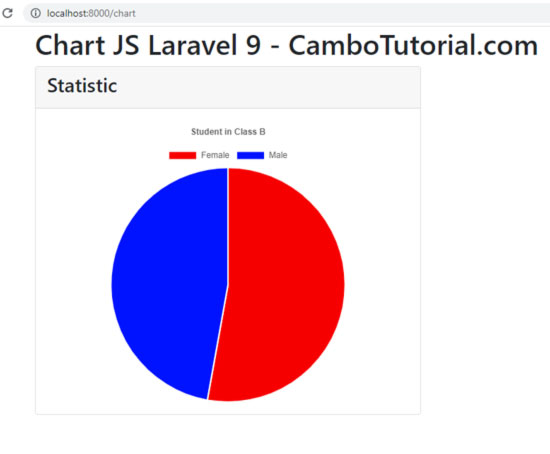
Hope this article help you to implement various charts with your statistic data. Have a nice day!
You might Also Like:
Laravel PHP Laravel 9

Author
As the founder and passionate educator behind this platform, I’m dedicated to sharing practical knowledge in programming to help you grow. Whether you’re a beginner exploring Machine Learning, PHP, Laravel, Python, Java, or Android Development, you’ll find tutorials here that are simple, accessible, and easy to understand. My mission is to make learning enjoyable and effective for everyone. Dive in, start learning, and don’t forget to follow along for more tips and insights!. Follow him
Search
Tags
Popular Articles
-
Laravel 9 Login Multiple Roles using Custom Middleware
17.46K -
Drag Drop File Upload with Dropzone.js in Laravel 8, Laravel 9
14.96K -
Laravel Mail - Laravel 9 Send Email Tutorial Example
12.97K -
How to Generate Dummy Data in Laravel 9
3.41K -
How to Install Laravel 9 PHP Framework
3.04K -
How to Upload File in Laravel 9 with Example
3K